


Global Demand for Oil and Gas is Up, and Rig Counts are Down
The Crude Truth about oil and gas is in the decline curves.

In a seemingly paradoxical twist for the energy sector, global demand for oil and gas continues to climb even as active rig counts worldwide trend downward. This dynamic highlights the industry's efficiency gains, technological advancements in extraction, and shifting investment priorities amid economic uncertainties. As we delve into the latest data from August 2025, we'll explore current rig counts globally and in the U.S., the substantial investments required to counteract natural production declines, and key considerations for investors seeking tax-advantaged private opportunities in the United States.
Finally, we'll examine how U.S.-specific tax incentives and royalty structures contribute to maintaining America's position as the world's largest oil producer.
Rising Global Demand Amid Economic Headwinds
Projections for 2025 indicate continued growth in global oil demand, albeit with some revisions downward due to factors like trade tariffs and slower economic expansion in key regions. According to the International Energy Agency (IEA), oil demand is expected to grow by approximately 635,000 barrels per day (b/d) in 2025, down from earlier estimates but still representing an upward trajectory from 2024 levels.
The Organization of the Petroleum Exporting Countries (OPEC) offers a more optimistic view, forecasting demand to average 105 million b/d this year, with growth driven by transportation fuels and non-OECD regions like China and India.
Despite potential headwinds from tariffs, which could reduce growth to less than half of prior forecasts.
The overall consensus is that demand will rise by 0.9-1.3 million b/d in non-OECD countries, offsetting minor declines in OECD nations.
This demand surge comes against a backdrop of supply constraints and geopolitical tensions, pushing prices higher and underscoring the need for sustained production. However, rig counts—a key indicator of exploration and development activity—tell a different story.
Rig Counts: A Global Snapshot
As of early August 2025, the global rig count stands at approximately 1,633 active rigs, down from previous periods and reflecting a year-over-year decline.
This total comprises 539 rigs in the U.S. (down 1 week-over-week and 49 year-over-year), 180 in Canada (up 3 week-over-week but down 37 year-over-year), and 914 internationally (up 1 month-over-month but down 20 year-over-year).
International Rig Counts by Region and Select Countries
International rig counts (excluding North America) are reported monthly, with July 2025 data showing 914 active rigs. While detailed country-by-country breakdowns are limited in recent reports, major regions and key producers include:
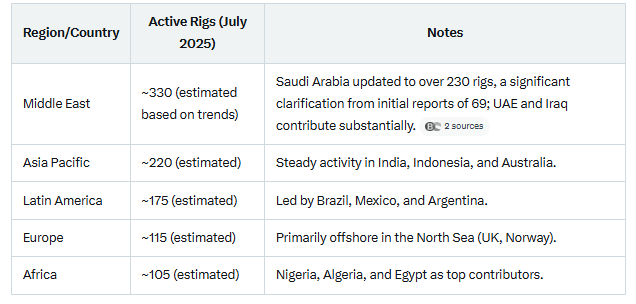
These figures represent a slight monthly increase but a broader annual decline, signaling caution among operators amid volatile prices and investment shifts.
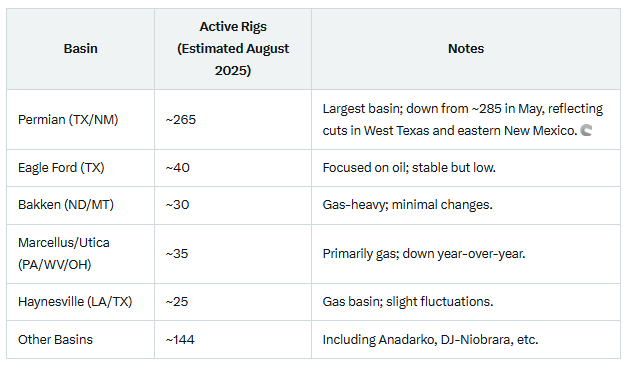
U.S. Rig Counts by State and Basin
In the U.S., the rig count as of August 8, 2025, is 539, with 411 oil rigs, 123 gas rigs, and 5 miscellaneous.
This marks the third consecutive weekly decline, down 1 from the prior week and reflecting a broader trend of reduced drilling activity.
Breakdowns by major basins and states (based on recent trends and proportional adjustments from May 2025 data, where the total was 578):
By State:
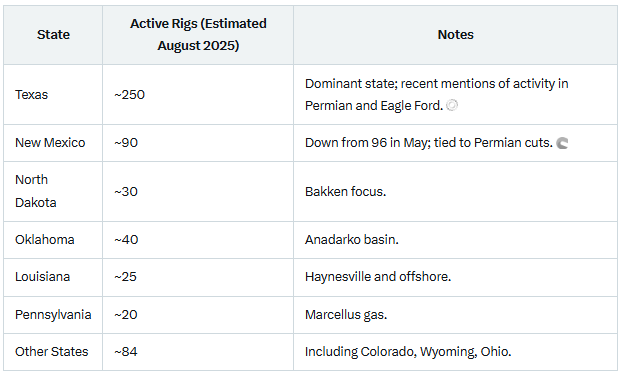
These declines persist despite rising demand, thanks to improved well productivity from technologies like longer laterals and enhanced fracking.
Investments Needed to Offset Decline Curves
Natural decline rates in existing oil fields typically range from 5-10% annually, meaning the world must add 5-10 million b/d of new production each year to maintain current output levels of around 100 million b/d.
To meet this while satisfying the growing demand, substantial capital is required. The IEA estimates upstream oil investment will fall 6% to $420 billion in 2025, with declines in U.S. light tight oil.
Overall energy spending could hit $3.3 trillion, but upstream oil and gas may see only ~$570 billion, down 4%.
Experts warn that trillions in cumulative investment are needed over the coming decades to avoid shortages, as continued capital discipline focuses on returns rather than expansion.
For 2025 alone, offsetting declines could require $500-800 billion globally, factoring in development costs of $10,000-20,000 per b/d of capacity in shale and higher in conventional fields. So to say that trillions of dollars need to be spent in exploration in the next decade is truly an understatement.
What Investors Should Look for in Private U.S. Oil and Gas Investments for Tax Advantages
Private investments in U.S. oil and gas, particularly direct participation programs (DPPs) for accredited investors, offer significant tax benefits under the Internal Revenue Code. Key advantages include:
Intangible Drilling Costs (IDCs): Deduct 70-100% of drilling expenses (e.g., labor, chemicals) in the first year, potentially offsetting up to 85% of an investment against ordinary income.
Percentage Depletion Allowance: Deduct 15% of gross income annually (Small Producer's Exemption), exceeding the actual cost basis and available indefinitely.
Bonus Depreciation: Under the new One Big Beautiful Bill Act (OBBBA), 100% first-year depreciation for qualified property acquired after January 19, 2025.
Tangible Drilling Costs (TDCs): Depreciate equipment over 7 years, with accelerated methods.
Loss Deductions and Passive/Active Income Rules: Working interests are active, allowing deductions against W-2 income; even dry holes yield nearly 100% write-offs.
Investors should prioritize accredited-only opportunities like limited partnerships or joint ventures in proven basins (e.g., Permian). Look for operators with strong track records, transparent royalty structures (12-20% to mineral owners), and compliance with SEC rules. Risks include volatility and dry wells, but tax savings can reduce effective costs by 40-50% for high earners.
Consult tax advisors to maximize benefits against alternative minimum tax (AMT) limitations.
Do Tax Advantages and Royalties Help Keep the U.S. as the Largest Oil Producer?
Absolutely. The U.S. is projected to produce a record 13.4 million barrels per day (b/d) in 2025, surpassing Saudi Arabia and Russia, primarily due to the shale revolution enabled by private land ownership and favorable policies.
Tax incentives like IDCs and depletion make investments more profitable, attracting capital that funds innovation and rapid scaling.
Royalties—typically 12-20% of gross production paid to private mineral owners—create incentives for leasing land, unlike state-owned resources in many OPEC nations, where governments capture most value.
This decentralizes production, speeds development on vast private acreages, and boosts output. Combined, these factors lower breakeven costs, enhance competitiveness, and sustain U.S. leadership despite lower rig counts.
In summary, while rig counts dip, demand's upward march demands smart investments. For U.S. investors, tax perks and royalties not only offer personal gains but also underpin national energy dominance.
You have heard me say this before: I prefer being part of the solution, providing low-cost energy to the United States market with the least impact on the environment possible. You may have also heard me say that the ESG movement over the last several years has helped ensure returns to stakeholders and investors in oil and gas. This commitment to returns not only sets the United States apart from the rest of the world, but it also sets the oil and gas market apart from the wind, solar, and hydrogen markets.
And that is the Crude Truth.
Stay tuned to Crude Truth for more insights into this evolving landscape.